
Топ программ по созданию инфографики
Согласитесь, однообразный текст без картинок, графиков, диаграмм и прочих дополнений вызывает скуку и напрочь отбивает охоту читать его дальше. И насколько же проще воспринимается даже самая серьезная и сложная информация, если она разбавлена дополнительными материалами. Они называются инфографикой. Создавать ее несложно: достаточно скачать редактор на свой компьютер или планшет. Также можно работать онлайн, используя один из конструкторов. Рассмотрим подробнее ТОП сервисов для создания инфографики, их плюсы и минусы.
Что такое инфографика
Итак, инфографика — это способ подачи контента, который подразумевает минимум текстовой информации и большое количество различных картинок, схем, карт и т. д. Ее главная задача — упростить и ускорить передачу каких-либо инструкций, фактов, статистики и прочего. Поэтому чаще всего ее используют в таких сферах, как образование, различные презентации и интернет-маркетинг.
На первый взгляд кажется, что этот простой инструмент ничем не отличается от обычных иллюстраций. Однако на самом деле отличия есть. Во-первых, иллюстрация больше рассчитана на эмоции, поэтому часто она не несет в себе никакой конкретики. Инфографика — это всегда факты и точные цифры. Во-вторых, в отличие от инфографики, картинки требуют пояснения и наличие сопроводительного текста.
Данный способ подачи контента бывает нескольких видов:
- Инструкции. Представляют собой визуализацию какого-либо процесса. Так, например, это может быть помощь в вопросе, как сделать новогоднюю поделку или салат оливье.
- Таймлайн или временная шкала. Показывает, в какой последовательности шли события. Обычно это прямая или изогнутая линия, которая обозначает какой-то период времени, и несколько тематических иллюстраций.
- Карты. Здесь все понятно без объяснений. Это классические, знакомые всем со школьных уроков географии карты местности. Это тоже один из видов инфографики.
- Характеристики. Описание свойств и отличий того или иного предмета. Чаще всего это его изображение крупным планом и подписи рядом.
- Сравнение. Это те же самые характеристики, но объединенные между собой.
Еще один распространенный вид инфографики — статистика. Использование графиков и диаграмм — это неоценимая помощь в попытках показать связь между какими-либо объектами или явлениями, и выделение самых важных моментов.
Существует десятки сервисов для создания инфографики. Между собой они отличаются набором функций, доступностью и другими параметрами.
Программы для создания инфографики онлайн
Canva
Ссылка на сервис – canva.com
Самый простой и популярный сервис для создания инфографики. На выбор пользователей представлено несколько сотен бесплатных шаблонов и множество полезных функций. Готовую инфографику можно создавать и после — скачивать бесплатно и в любом формате. У сервиса очень простой и понятный интерфейс с набором всех необходимых для редактирования инструментов.
Canva имеет бесплатную версию и набор дополнительных платных функций. Ее главными преимуществами являются:
- наличие большого количества бесплатных шаблонов;
- больше 100 типов дизайнов;
- бесплатная версия с возможностью обработки фото, а также создания графиков и диаграмм;
- бесплатное «облако» с 5 Гб памяти;
- возможность применять свой шрифт;
- наличие платного тарифа с расширенным набором инструментов для создания инфографики.
Из недостатков приложения можно выделить отсутствие анимированных функций, интеграции данных в реальном времени и возможности вставлять видеоролики.
Piktochart
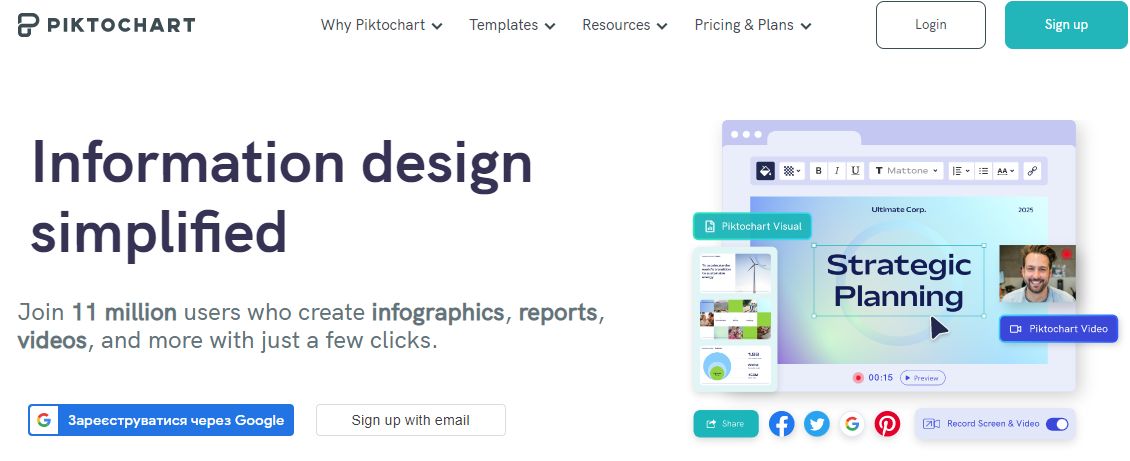
Ссылка на сервис – https://piktochart.com/
Этот сервис для создания инфографики такой же простой в использовании, как и предыдущий. Но у него нет русского языка, весь интерфейс на английском. Поэтому нужно либо владеть языком, либо разбираться интуитивно.
Главным отличием Piktochart от других программ для создания инфографики является наличие определенной структуры у шаблонов и расширенного содержания. С их помощью можно бесплатно делать не только графики и диаграммы, но и презентации, различные отчеты и т. д. Система имеет несколько тематических разделов, множество полезных функций, как, например, добавление текста, значков, карт или видео.
В Piktochart можно создавать инфографику бесплатно, поскольку здесь есть бесплатная версия. Также выгодно приобрести платную версию с расширенным доступом. Все элементы удобно разделены на категории, что значительно упрощает поиск. К тому же редактор оснащен уже готовыми цветовыми схемами.
BeFunky
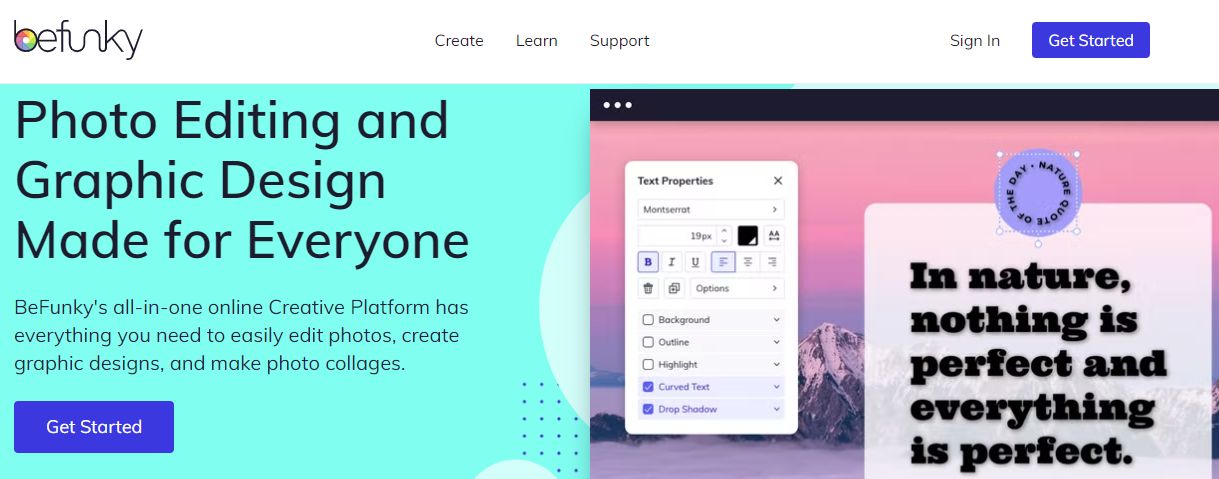
Ссылка на сервис – https://www.befunky.com/
Еще один сервис для создания инфографики с бесплатной версией и платной стоимостью около 7 долларов в месяц. Изначально его создавали как редактор фотографий и конструктор, в котором можно бесплатно делать коллажи.
В бесплатной версии есть всего 1 шаблон. Платная же версия предлагает еще 3. Немного, но с учетом того количества инструментов, с помощью которых можно структурировать информацию, достаточно и этого. Каждый пользователь получает доступ к различным фотостокам, набору шрифтов и иконок. Благодаря этому можно сделать любые по стилю и дизайну баннеры, плакаты, сравнительные таблицы и т. д.
Visme
Ссылка на сервис – https://www.visme.co/
Платная версия этого сервиса по созданию инфографики предлагает два тарифа:
- 20$ — позволяет вести одновременно до 15 проектов, предоставляет хранилище объемом до 250 Мб, есть возможность создания цветовой палитры. Пользователи могут выбирать любую из премиум-функций.
- 30$ — количество проектов неограниченно, объем хранилища 10 Гб, в распоряжении пользователя библиотека слайдов. Редактор позволяет записывать аудио и организовывать данные с помощью папок.
В отличие от платной версии, бесплатная предоставляет всего 7 шаблонов. Но удобно бесплатно создать их и с нуля, используя набор шрифтов, изображений, значков и прочих полезных дополнений. При необходимости можно загружать аудио и видеозаписи, а также делать озвучку онлайн в самом конструкторе.
Интересная особенность Visme — возможность настраивать параметры конфиденциальности. Редактор позволяет открыть файлы для общего просмотра, для определенной группы лиц или только по приглашению. Готовую инфографику можно загрузить в блоги или на сайты, а также обмениваться ею через соцсети.
Easelly
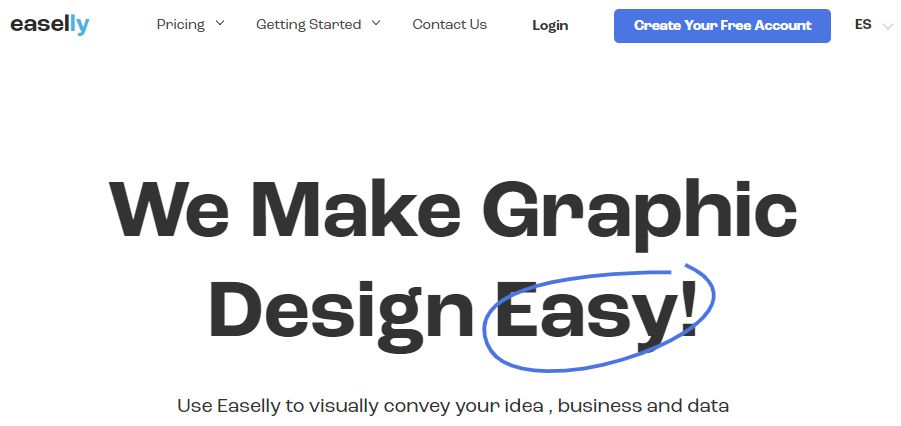
Ссылка на сервис – https://www.easel.ly/
В этом сервисе для создания инфографики можно работать бесплатно. Также есть платная версия, представленная двумя тарифами: от 3 и от 4$. Они включают в себя сотни тысяч премиум-иконок, более 300 000 фотографий, 20 графиков, больше сотни шрифтов и 300+ шаблонов. Приятный бонус — возможность персональных консультаций с менеджерами. Пробной версии на этом сервисе нет.
Какие инструменты есть в редакторе:
- Редактирование уже готового шаблона.
- Создание своего шаблона с нуля.
- Выбор цвета объекта, его размера, надписей, расположения.
- Загрузка своих изображений.
- Добавление фонов, стрелок и т. д.
При необходимости инфографику можно загрузить в формате JPEG или поделиться ею в блоге и на сайте.
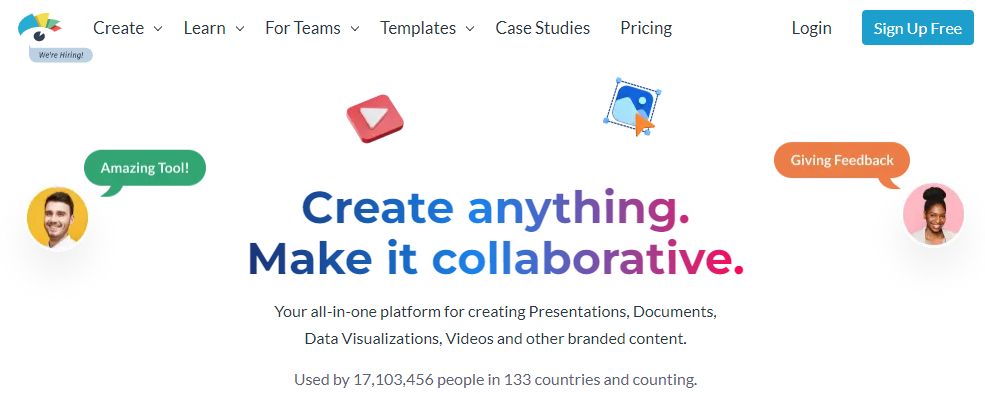
Venngage

Ссылка на сервис – https://ua.venngage.com/
Хороший сервис для создания таких видов визуального контента, как отчеты, плакаты, афиши и т. д. Но есть один большой минус — отсутствие интерфейса на русском языке.
Пользователям, которые только зарегистрировались в системе, доступны подсказки, исчезающие после сохранения первого проекта. Все шаблоны собраны в категории. Это инфографика, отчеты, логотипы, графики, диаграммы. Каждый раздел делится еще на несколько подразделов. Так, инфографика включает в себя информационный подраздел, статистический, сравнительный, географический.
При работе с этим сервисом удобно бесплатно загружать видео с различных платформ, например, YouTube, добавлять надписи и опросы, менять шрифт, цвет, фон, расположение объектов. Готовые проекты можно либо сохранять и в дальнейшем снова редактировать, либо публиковать в соцсетях.
Бесплатная версия содержит меньше инструментов и функций, чем платная. Пробного периода нет. В платной версии доступно несколько тарифов. Так, например, за 19$ в месяц система дает премиум-шаблоны, 50 изображений для загрузки, возможность добавлять несколько страниц и пользоваться премиум-иконками. А за 49$ пользователь получает практически неограниченные возможности. Плюс к этому, он может консультироваться с менеджером и участвовать в живых консультациях.
Snappa
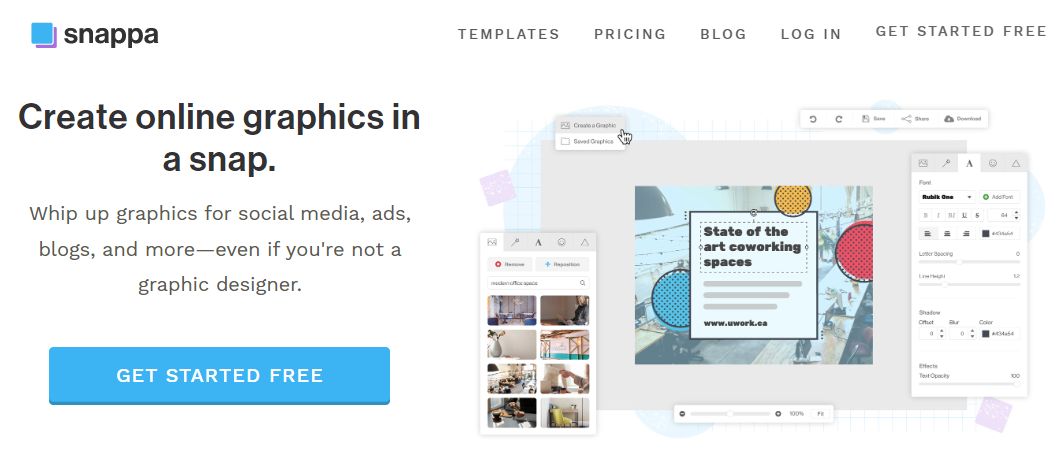
Ссылка на сервис – https://snappa.com/
Подобно другим редакторам, имеет бесплатную и платную версию. Подходит для использования и отдельными пользователями, и компаниями. Имеет такие полезные функции, как оповещение об акциях и запланированный постинг в социальных сетях.
Система предлагает около 50 бесплатных шаблонов, набор диаграмм и форм, и возможность настраивать параметры согласно своим предпочтениям и требованиям. Интерфейс простой и понятный. При необходимости можно воспользоваться обучающими статьями и видеороликами.
Пользователи могут применять ресурсы сайта или же загружать свои собственные. Готовые проекты, при желании, экспортируются в социальные сети (это бесплатно). А вот для их сохранения придется купить подписку. Стоимость в среднем 10-20$.
Genially
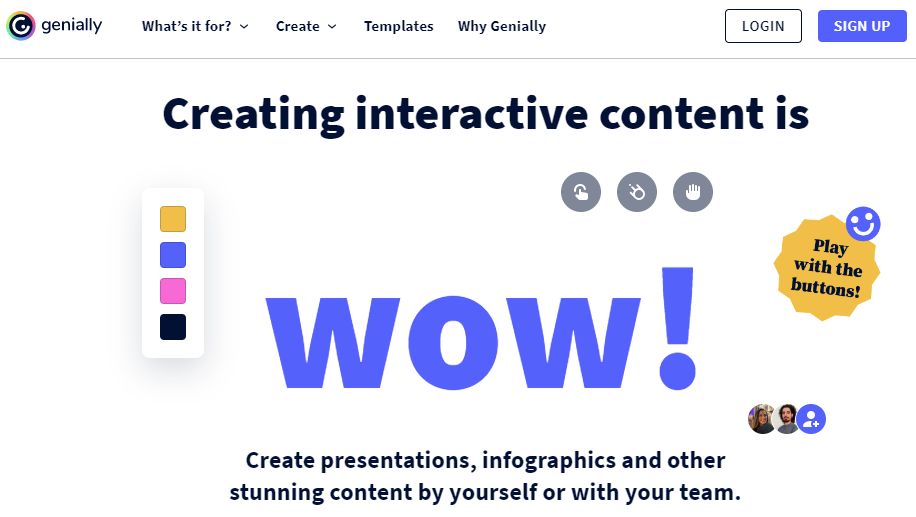
Ссылка на сервис – https://genial.ly/
Хороший сервис для создания презентаций и инфографики в режиме онлайн. Даже в бесплатной версии пользователи могут создавать полноценные графики, диаграммы, таблицы, сравнения и т. д. В их распоряжении набор всех необходимых инструментов. В платной версии становятся доступными дополнительные шаблоны и некоторые возможности.
Система предлагает множество готовых шаблонов и объектов. Среди них:
- изображения;
- текстовые блоки;
- графики и диаграммы;
- иконки;
- анимации;
- смарт-объекты;
- загрузка роликов с внешних ресурсов.
Помимо презентаций и обычной инфографики, с помощью сервиса можно создавать отчеты, показывающие динамику роста, проекты с геймификацией (использование игровых элементов), интерактивные плакаты и руководства пользователя, различные тесты.
Infogram
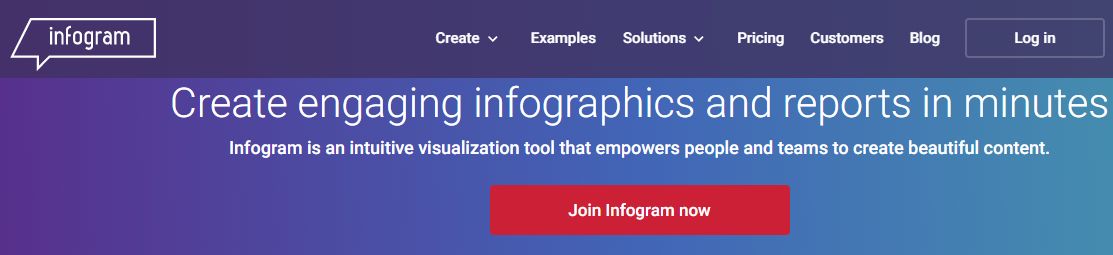
Ссылка на сервис – https://infogram.com/
Этот ресурс больше подходит для создания инфографики статистического типа. Его главными особенностями являются:
- Наличие более 35 шаблонов графиков и около 500 карт, позволяющих создавать диаграммы, гистограммы, таблицы и т. д.
- Контент можно дополнять значками, фотографиями, анимациями либо из библиотеки на сайте, либо со своего устройства.
- Для оформления предусмотрено более 20 тем, шрифтов и цветов.
- Готовые проекты можно сохранить в выбранном формате или выложить в социальные сети.
Пользователям доступна бесплатная версия с возможностью создания до 10 проектов по 3 страницы в каждом. Платные версии увеличивают количество проектов и страниц в них. Так, за 25$ можно делать до 100 проектов емкостью до 10 страниц, а за 179$ — до 3000 с неограниченным количеством страниц.
Итого, сервисов для создания инфографики очень много. И каждый из них предлагает самые разнообразные инструменты для оформления контента. Какой из них лучше, сказать однозначно невозможно, поскольку свои плюсы и минусы есть у каждого. Ориентироваться нужно на свои потребности и возможности.
Эксперт в области интернет-маркетинга. Руководитель маркетингового агентства MAVR.
Бизнес-степень «Мастер делового администрирования» (MBA).